Real-Time Dashboards: When They Help, When They Distract
Real-time dashboards have a certain appeal. Numbers move. Alerts blink. Charts refresh before anyone has time to finish a cup of coffee. It feels like control.
Sometimes it is control. Sometimes it is just motion.
The difference matters. Real-time data can help a business react faster, prevent losses, and spot problems before customers complain. But when every metric is live, every small fluctuation starts to look urgent. Teams begin chasing noise. Managers refresh screens instead of making decisions.
Real-time analytics is valuable only when the business can do something with the signal.
Not Every Metric Deserves to Be Live
The first rule is simple: if a metric cannot trigger an action, it probably does not need to update every minute.
Website uptime? Yes, real-time matters. Payment failures? Definitely. Delivery delays, support queue spikes, fraud signals, server load, stockouts, safety alerts – these can justify immediate visibility.
Quarterly revenue forecast? Brand awareness? Employee engagement? These are important, but refreshing them every thirty seconds will not make them more useful.
A live dashboard should be reserved for metrics where timing changes the outcome. If seeing the number now helps the team act better than seeing it tomorrow, real-time may be worth it. If not, a daily or weekly view is usually calmer and clearer.
Real-Time Requires Clear Ownership
A blinking alert without an owner is just anxiety with a color code.
Before making a metric live, decide who responds to it. If support backlog crosses a threshold, who checks staffing? If failed payments rise, who investigates the payment provider? If inventory drops below a safe level, who approves replenishment?
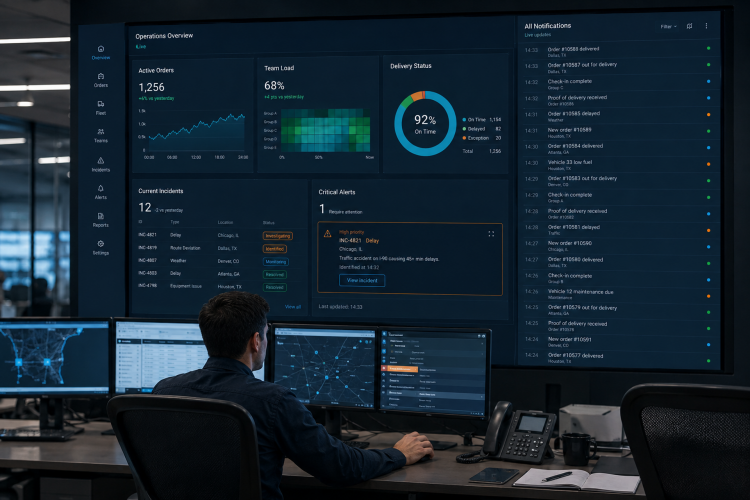
Real-time dashboards should work like a well-designed control room. The signal appears, the responsible person understands it, and the next step is clear. Without this chain, live data creates meetings, messages, and confusion.
The dashboard should not simply say "something changed." It should help the team know what kind of change it is, how serious it is, and who should look first.
Thresholds Beat Constant Watching
Many teams make the mistake of turning real-time analytics into a surveillance habit. Someone keeps a dashboard open all day, waiting for movement.
That is not a process. That is a very expensive screensaver.
A better approach is to define thresholds and alerts. What range is normal? What range needs attention? What range needs immediate action? The dashboard can still be live, but the team does not need to stare at it.
Thresholds should be reviewed regularly. If an alert fires every hour, people will stop caring. If it never fires, it may be too strict or irrelevant. Good alerting is tuned, not guessed.
Context Prevents Overreaction
Real-time data is especially easy to misread because it shows small movements before the full pattern appears.
A sudden drop in traffic may be a tracking issue. A spike in support tickets may come from one large customer. A sales dip may be normal for a certain day of the week. Without context, teams may act too quickly and create more problems than they solve.
Useful live dashboards include context around the signal:
- comparison with the same time yesterday or last week;
- expected range;
- related metrics;
- recent changes or incidents;
- data freshness and source status.
The point is to slow down panic without slowing down response.
Real-Time and Historical Views Should Work Together
A live dashboard tells you what is happening now. It does not always tell you why.
For that, teams need historical analysis. If support backlog is rising, the live view shows the pressure. The historical view may show that Mondays are always heavier, one product category creates more tickets, or a recent release changed the pattern.
Real-time dashboards are strongest when they connect to deeper analytics. The first screen should detect the issue. The next layer should help diagnose it. The final layer should support a decision.
This is where interactive BI matters. A static live number is helpful for a moment. A live number connected to drill-downs, filters, and trend analysis becomes a management tool.
Where Real-Time Helps Most
Real-time analytics is especially useful in areas where delays are costly:
- customer support queues;
- ecommerce checkout and payment monitoring;
- logistics and delivery tracking;
- operational capacity;
- security and fraud monitoring;
- infrastructure performance;
- campaign launches;
- inventory availability.
In all of these cases, the business can act while the situation is still changing.
The key is restraint. A focused real-time dashboard with five meaningful signals is usually better than a glowing wall of fifty live metrics.
Final Thought
Real-time dashboards should make a business calmer, not more nervous.
They are not there to prove that the company is modern. They are there to shorten the distance between signal and action. Before making a metric live, ask three questions:
Who needs to know? What will they do? How fast does the decision really need to happen?
If the answers are clear, real-time analytics can be powerful. If they are not, the dashboard may only create the illusion of control.